
Introduction
Reliable and impartial scientific information about the occurrence, quantity, quality, distribution, and movement of water is essential to resource managers, planners, and others throughout the Nation. The U.S. Geological Survey (USGS), in cooperation with numerous local, State, and Federal agencies, collects hydrologic data and conducts studies to monitor hydrologic conditions and better define the water resources of Georgia and other States and territories.
Groundwater-level and groundwater-quality data are essential for water-resources assessment and management. Water-level measurements from observation wells are the principal source of information about the hydrologic stresses on aquifers and how these stresses affect groundwater recharge, storage, and discharge. Long-term, systematic measurement of water levels provides essential data needed to develop groundwater flow models, evaluate storage changes over time, forecast trends, and design, implement, and monitor the effectiveness of groundwater management and protection programs (Taylor and Alley, 2001). Groundwater-quality data are necessary to protect groundwater resources, because deterioration of groundwater quality may be virtually irreversible, and treatment of contaminated groundwater can be expensive (Alley, 1993).
Purpose and Scope
This website presents an overview of groundwater levels throughout Georgia. It is a continuation of a series of reports begun in 1978. Water-level data are summarized in graphs and maps. Groundwater levels in major aquifers are presented on hydrographs for wells selected to represent the aquifer. Trends in water levels can be calculated and visualized for each hydrograph using a calculator incorporated in this website. Additional information about the wells included in this website can be obtained from the USGS National Water Information System (NWIS) database at http://waterdata.usgs.gov/ga/nwis/gw/.
Cooperating Organizations and Agencies
Groundwater monitoring in Georgia is conducted in cooperation with numerous local organizations, private companies, and State and Federal agencies. Cooperating organizations and agencies include the following:
- City of Albany Utility Operations
- Augusta Utilities Department, City of Augusta
- Georgia Department of Natural Resources, Environmental Protection Division
- Glynn County Joint Water and Sewer Commission
- Molson Coors Beverage Company
- National Ground-Water Monitoring Network
- Jekyll Island Authority
Organizations have access to USGS Cooperative Matching Funds (CMF) which support joint projects with state, regional, tribal, and local partners to provide reliable, impartial, and timely information needed to understand and manage the Nation's water resources. A more complete description of the CMF is provided on the USGS Cooperative Matching Funds website: https://www.usgs.gov/mission-areas/water-resources/science/usgs-cooperative-matching-funds?qt-science_center_objects=0#qt-science_center_objects (USGS, accessed June 4, 2021).
Linear Trend Lines and Regression Statistics
Water-level trend lines are generated by Simple Linear Regression. The "Simple Regression" button calculates the trend line for the current set of data displayed in the graph.
Dates with null values are not used in the trend line calculations.
η represents the sample size
y-intercept a = [ (∑y)(∑x2) - (∑x)(∑xy) ] / [ η(∑x2) - (∑x)2 ]
slope b = [ η(∑xy) - (∑x)(∑y) ] / [ η(∑x2) - (∑x)2 ]
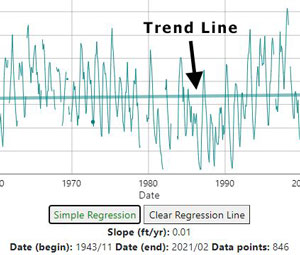
Example of Trend Anaylsis Graph with trend line and control buttons.
Arrow icons for the maps represent the upward or downward trend, and are calculated using the last 10 years of data. Simple Linear Regression is used to calculate the trend. If the well does not have 10 years of data, or if the trend is less than 0.01 ft/year, a circle icon is displayed, instead of an arrow. Split color icons represent wells with trend analysis graphs at the bottom of each aquifer page.
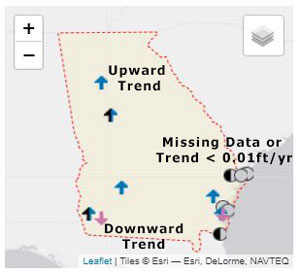
Example of map with arrow and circle icons
Methods of Analysis, Sources of Data, and Data Accuracy
Hydrologic Conditions for Select wells
The hydrologic conditions for select wells are summarized annually using the groundwater-level monthly statistics tables from NWISweb (https://waterdata.usgs.gov/nwis/gw). These tables present the monthly mean depth to water level in feet below land surface for each month (columns) of every year (rows) during the period of record for a particular well. The last row in the table is the mean of the monthly means (for example, the mean of all January means in the period of record, the mean of all February means in the period of record, etc.). The range of the mean of monthly water levels for the current year is compared to the range of the mean of monthly means (last row in the table) to determine if water levels during the year were generally above or below mean water levels for the period of record. For example, USGS has been continuously recording water levels in well 16MM03, a crystalline rock aquifer well in the Piedmont/Blue Ridge, since 1988 (Period Of Record "POR" from 1988 to present). During 2023, the maximum monthly mean water level was 4.4 (January 2023) and the minimum was 6.2 (November 2023). Therefore, the monthly means for 2023 (for all months that are populated/available in the monthly mean table) are all lower than the mean monthly values calculated for each month.
2024 Drought Conditions
Groundwater levels vary depending on the amount of recharge and discharge to and from an aquifer. Precipitation affects groundwater levels because not only does it provide recharge to an aquifer (increases in water levels), but it can decrease the amount of discharge from the aquifer because the overall need for irrigation is decreased. The lack of rainfall could cause increased need for irrigation and therefore a decrease in groundwater levels. These maps from the National Integrated Drought Information System show when and where dry conditions were occurring in Georgia during 2024. Georgia received above average rainfall during 2024 (National Oceanic and Atmospheric Administration, 2025). The maps below show abnormally dry to severe drought over most of the State on July 2, 2024, then most of the State experienced abnormally dry conditions during November 5, 2024 (U.S. Drought Monitor, 2024).
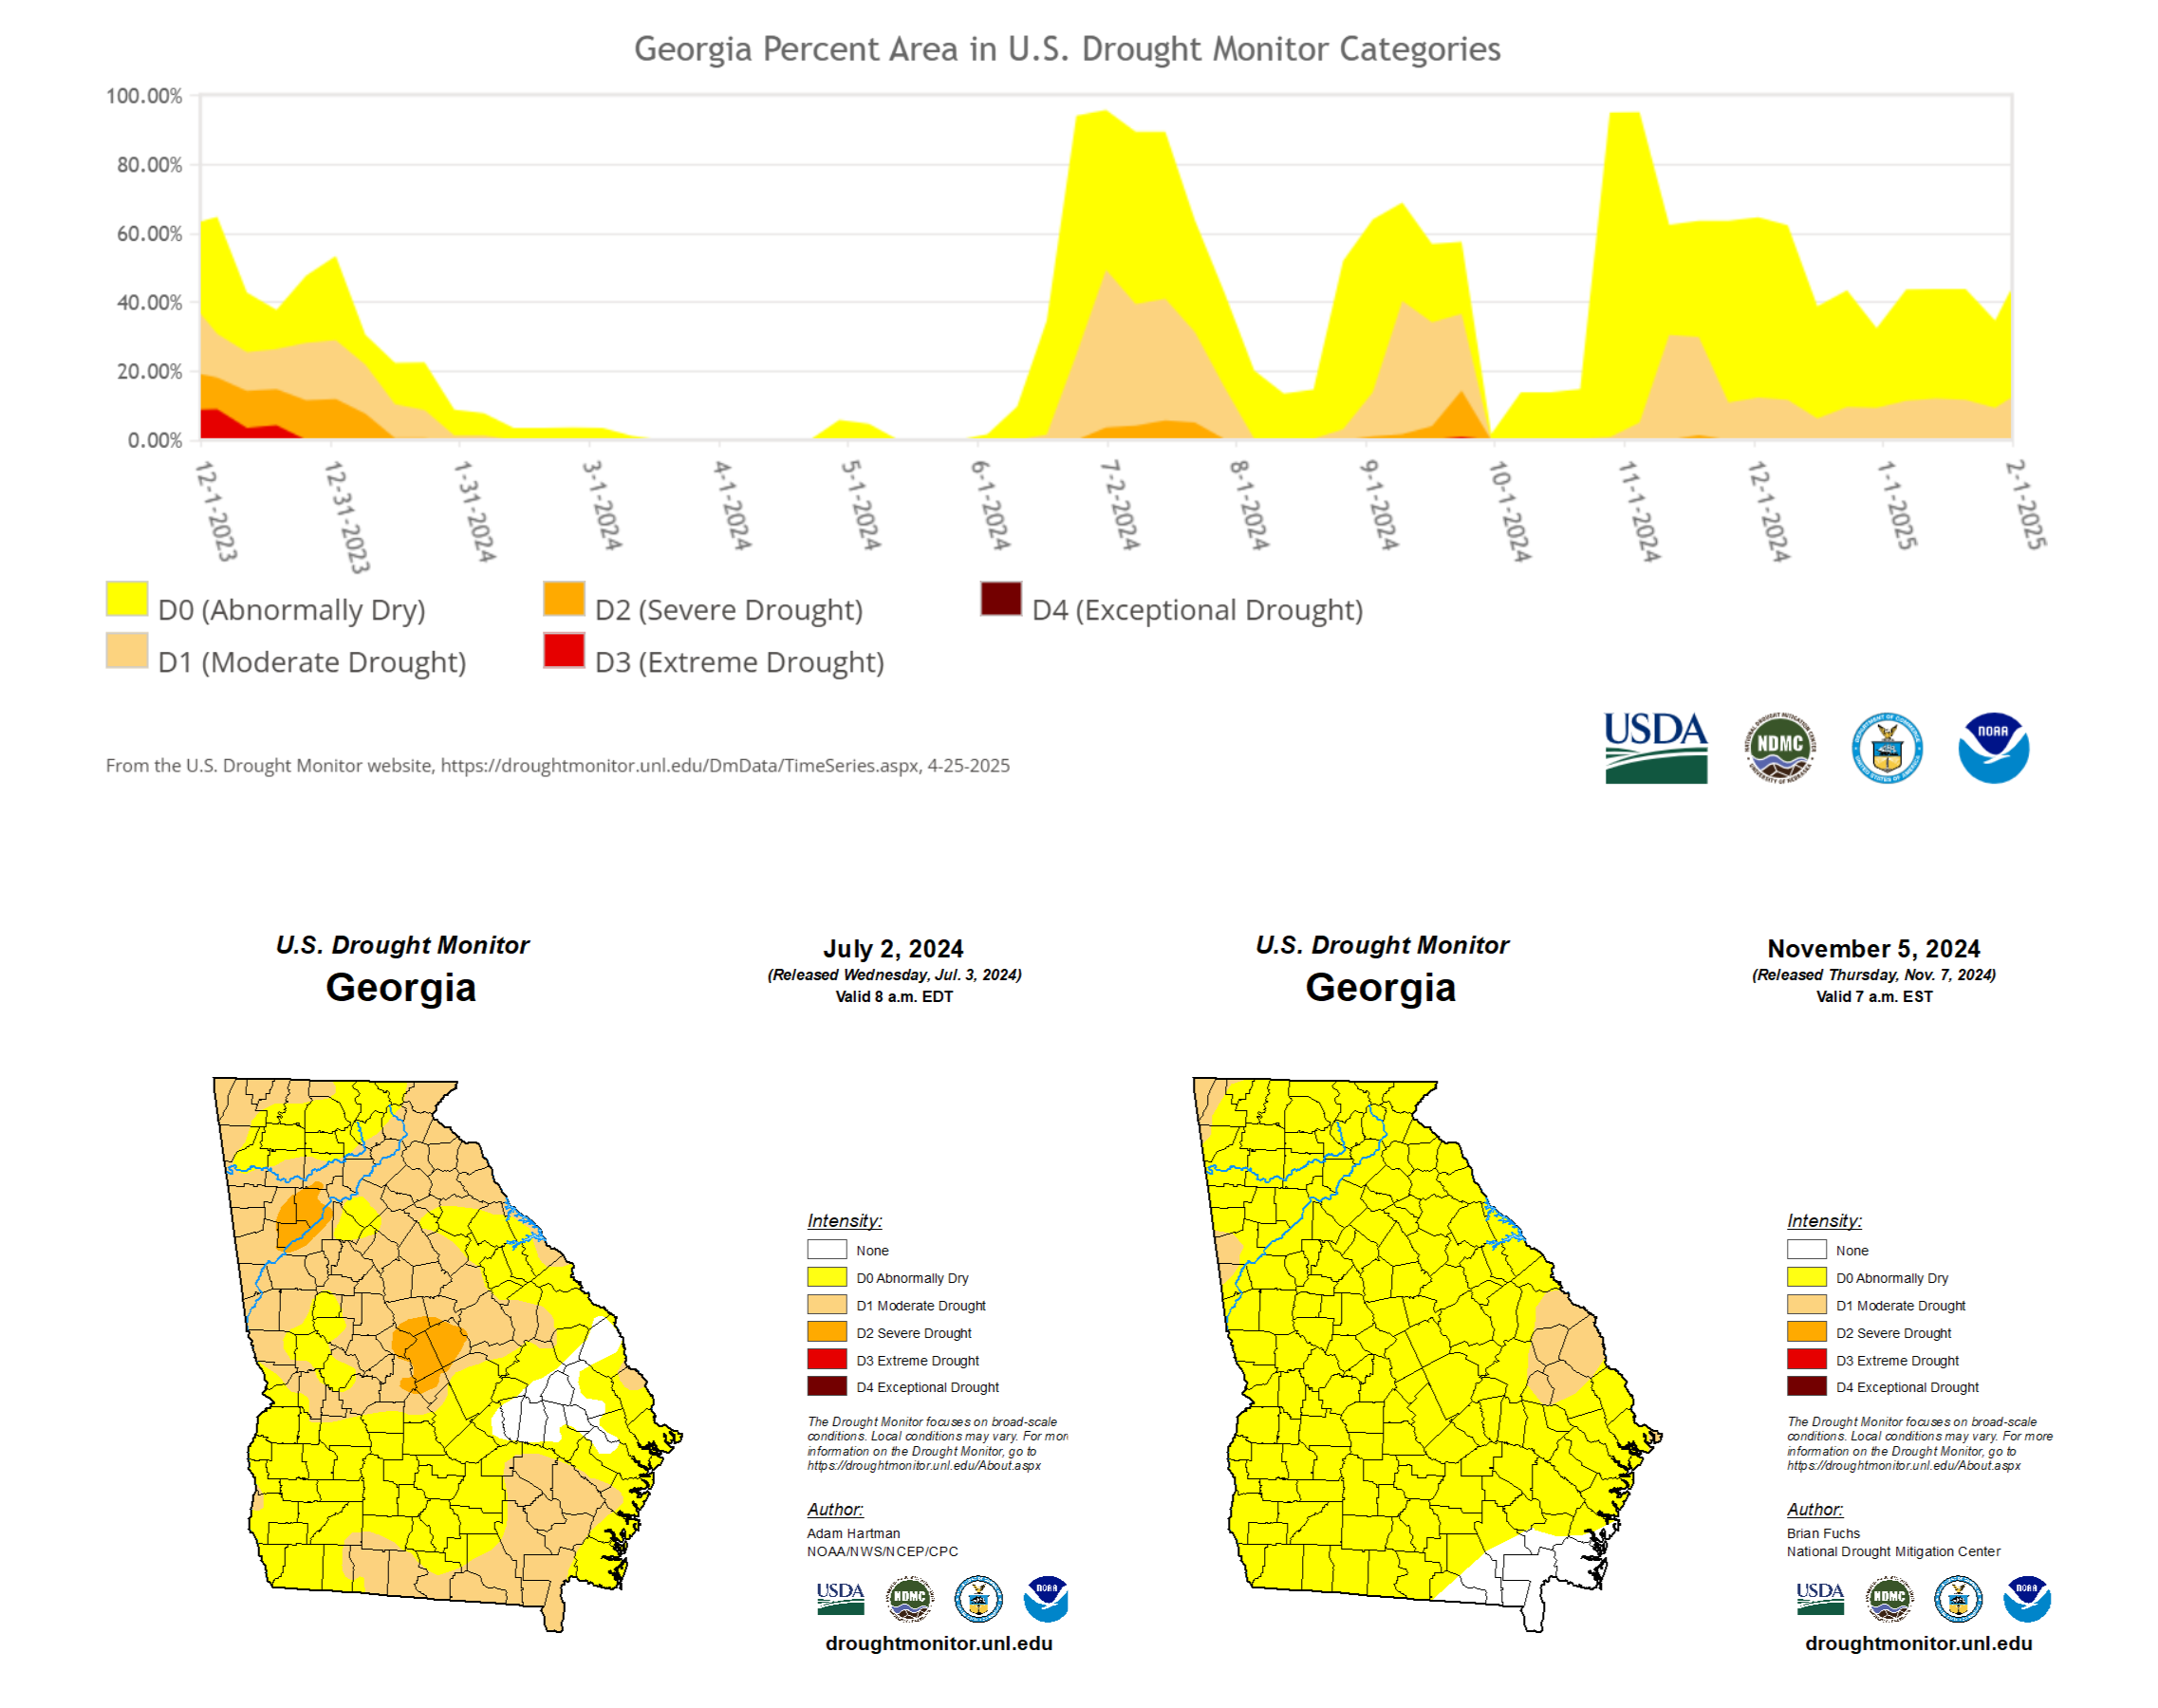
The U.S. Drought Monitor is jointly produced by the National Drought Mitigation Center (NDMC) at the University of Nebraska-Lincoln, the United States Department of Agriculture, and the National Oceanic and Atmospheric Administration. Map courtesy of NDMC.
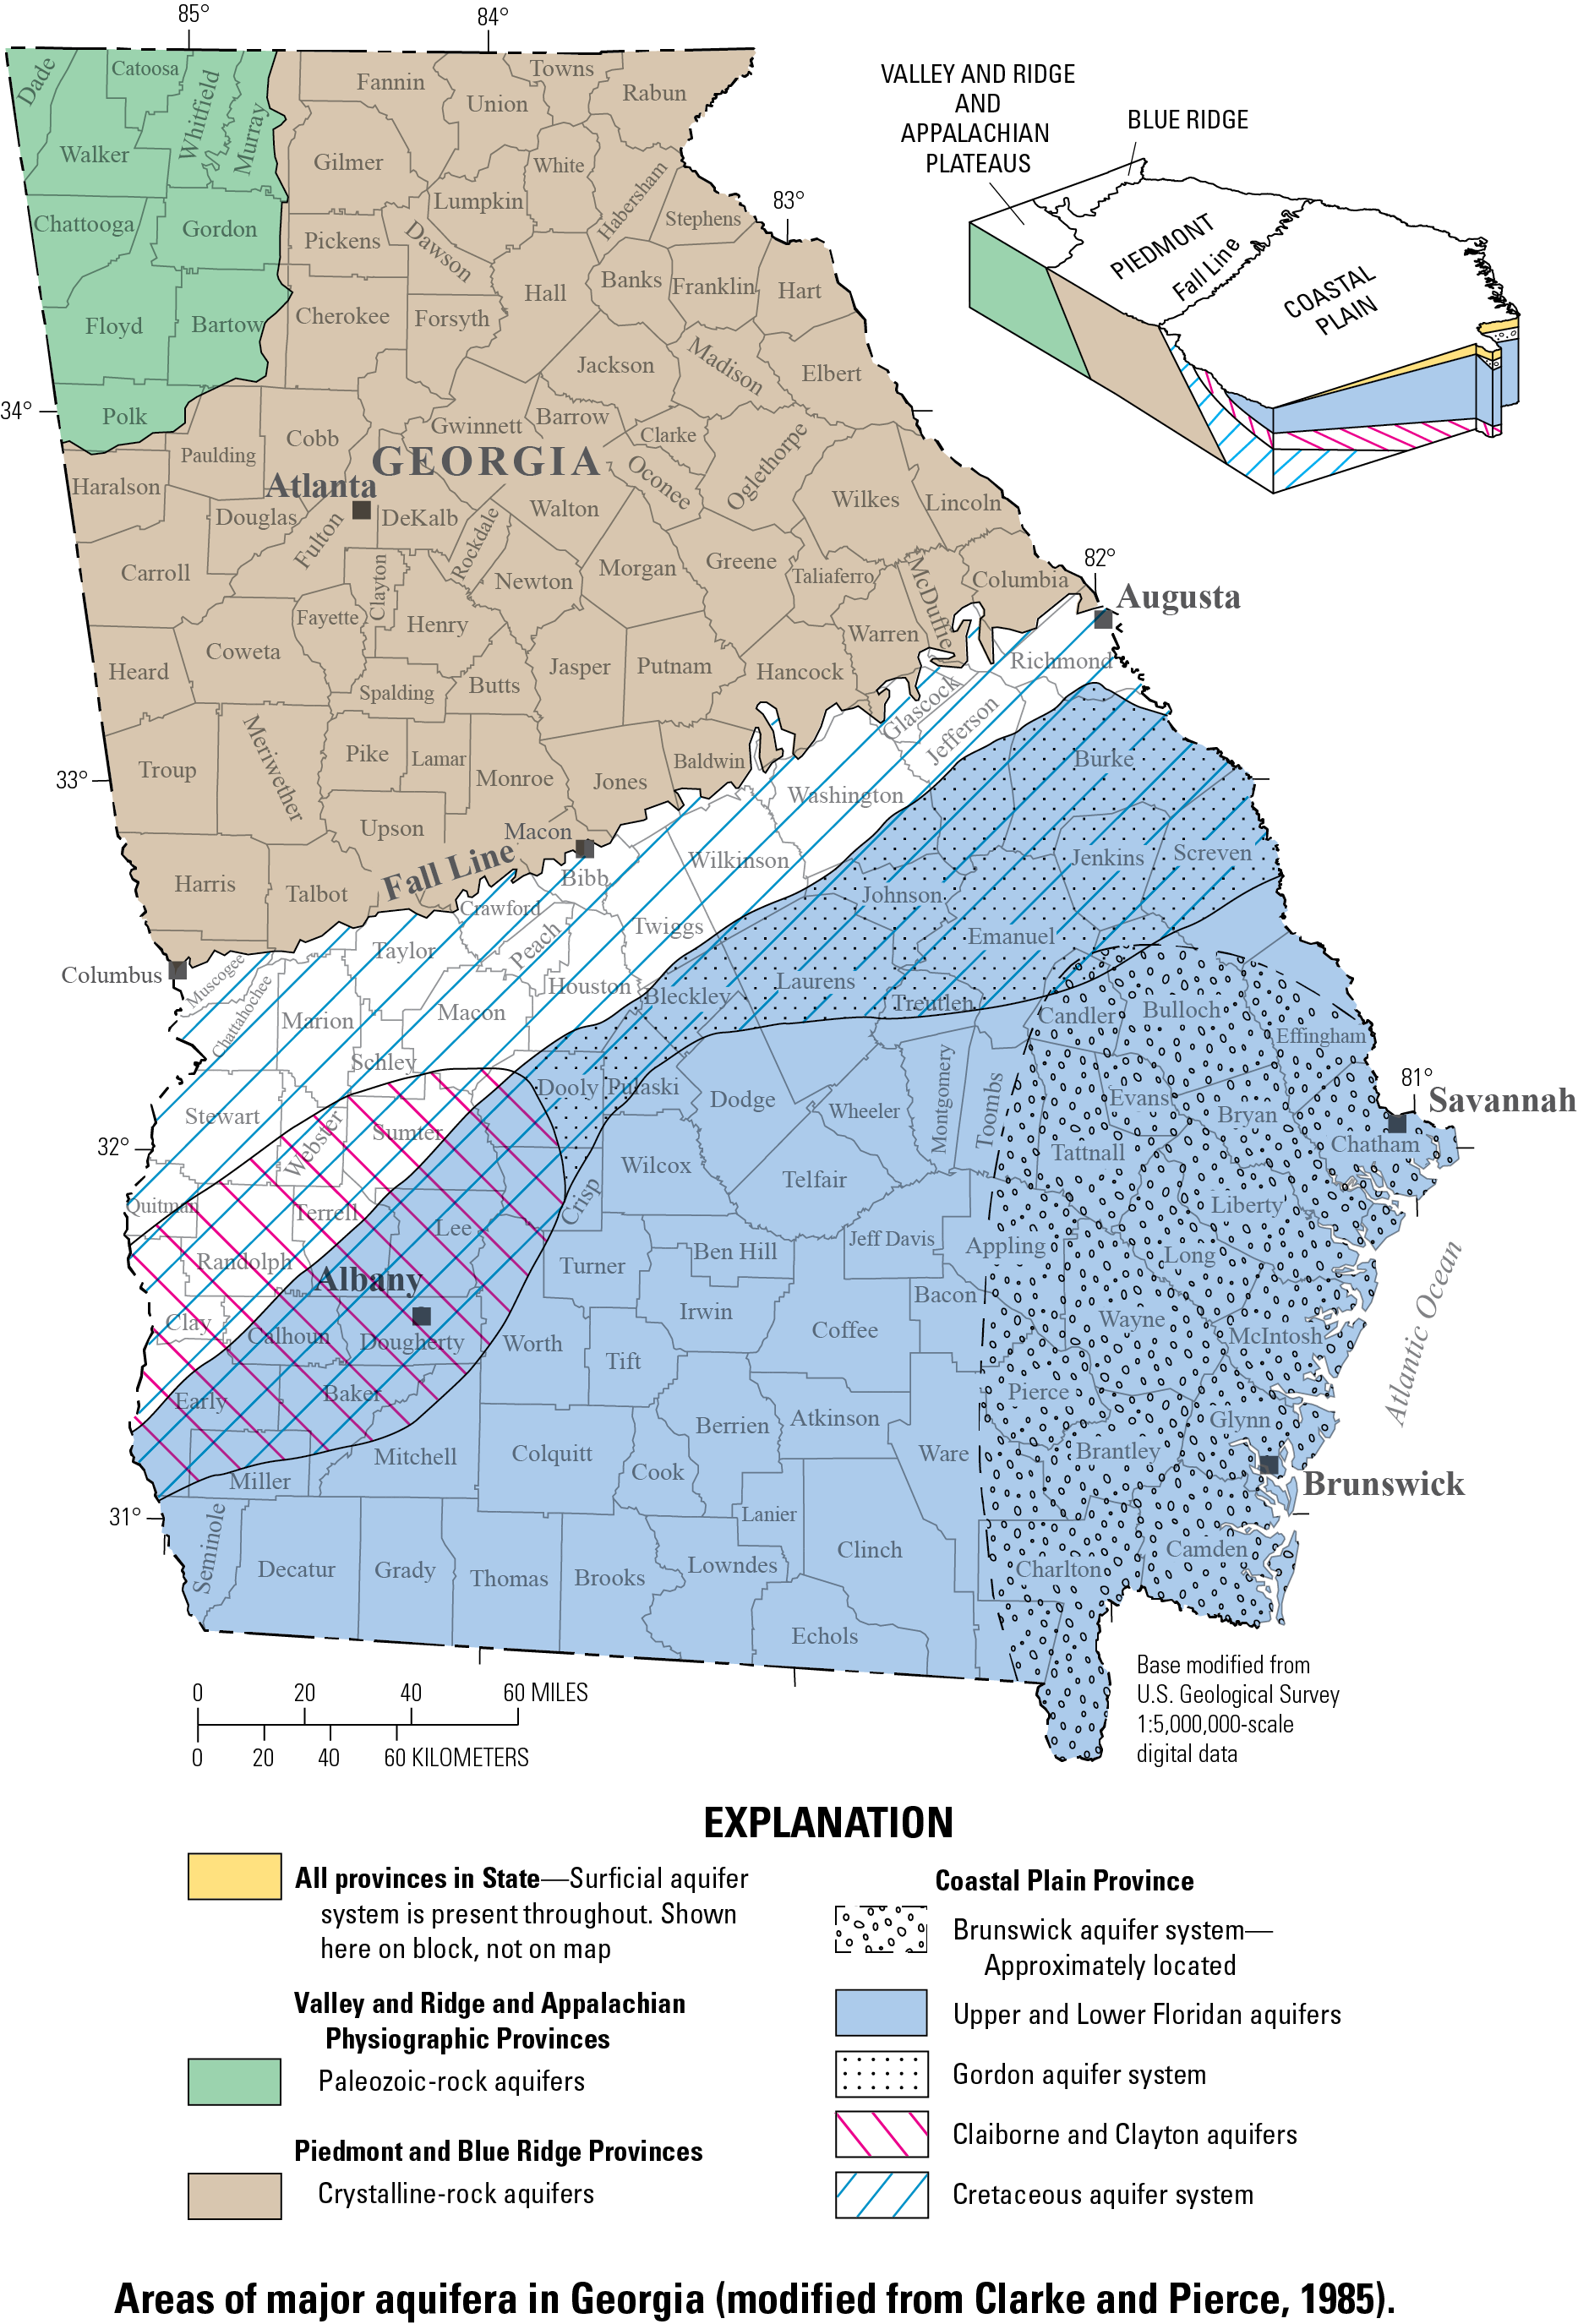
Groundwater Resources
Contrasting geologic features and landforms of the physiographic provinces of Georgia (see map above) affect the quantity and quality of groundwater throughout the State. The surficial aquifer system is present in each of the five physiographic provinces in Georgia. In the Coastal Plain Province, the surficial aquifer system consists of layered sand, clay, and in some places limestone. The surficial aquifer system typically is under water-table (unconfined) conditions and provides water for domestic and livestock use. The surficial aquifer system can be semiconfined to confined locally in the coastal area. In the Piedmont, Blue Ridge, and Valley and Ridge Provinces, the surficial aquifer system consists of soil, saprolite, stream alluvium, colluvium, and other surficial deposits.
The most productive aquifers in Georgia are in the Coastal Plain Physiographic Province in the southern half of the State. The Coastal Plain is underlain by alternating layers of sand, clay, dolomite, and limestone that dip and thicken to the southeast. Coastal Plain aquifers generally are confined, except near their northern limits where the aquifers crop out or are near land surface. Aquifers in the Coastal Plain include the surficial aquifer system, Brunswick aquifer system, Floridan aquifer system, Gordon aquifer, Claiborne aquifer, Clayton aquifer, and Cretaceous aquifer system.
In the Valley and Ridge Physiographic Province, groundwater is transmitted through primary and secondary openings in folded and faulted sedimentary and metasedimentary rocks of Paleozoic age. In this website, the aquifers are referred to as “Paleozoic-rock aquifers.”
In the Piedmont and Blue Ridge Physiographic Provinces, the geology is complex and consists of structurally deformed metamorphic and igneous rocks. Groundwater is transmitted through secondary openings along fractures, foliation, joints, contacts, or other features in the crystalline bedrock. In this website, the aquifers are referred to as “crystalline-rock aquifers.” A more complete discussion of the State’s groundwater resources is provided in Clarke and Pierce (1985).
Selected References
- Alley, W.M., 1993, General design consideration, in Alley, W.M., ed., Regional groundwater quality: New York, Van Nostrand Reinhold, 634 p.
- Clarke, J.S., 2003, The surficial and Brunswick aquifer systems—Alternative groundwater resources for coastal Georgia, in Hatcher, K.J., ed., Proceedings of the 2003 Georgia Water Resources Conference, April 23–24, 2003: Athens, Georgia, University of Georgia, https://smartech.gatech.edu/handle/1853/48399.
- Clarke, J.S., Brooks, Rebekah, and Faye, R.E., 1985, Hydrology of the Dublin and Midville aquifer system of east-central Georgia: Georgia Geologic Survey Information Circular 74, 62 p., https://epd.georgia.gov/sites/epd.georgia.gov/files/related_files/site_page/IC-74.pdf.
- Clarke, J.S., Faye, R.E., and Brooks, Rebekah, 1983, Hydrogeology of the Providence aquifer of southwest Georgia: Georgia Geologic Survey Hydrologic Atlas 11, 5 sheets, https://epd.georgia.gov/sites/epd.georgia.gov/files/related_files/site_page/HA-11.pdf.
- Clarke, J.S., Hacke, C.M., and Peck, M.F., 1990, Geology and groundwater resources of the coastal area of Georgia: Georgia Geologic Survey Bulletin 113, 106 p., https://epd.georgia.gov/sites/epd.georgia.gov/files/related_files/site_page/B-113.pdf.
- Clarke, J.S., and Pierce, R.R., 1985, Georgia groundwater resources, in U.S. Geological Survey, National Water Summary, 1984: U.S. Geological Survey Water-Supply Paper 2275, p. 179–184, https://pubs.er.usgs.gov/publication/wsp2275.
- Cressler, C.W., 1964, Geology and groundwater resources of Walker County, Georgia: Georgia Geologic Survey Information Circular 29, 15 p., https://epd.georgia.gov/sites/epd.georgia.gov/files/related_files/site_page/IC-29.pdf
- Cressler, C.W., Thurmond, C.J., and Hester, W.G., 1983, Groundwater in the greater Atlanta region, Georgia: Georgia Geologic Survey Information Circular 63, 144 p., https://epd.georgia.gov/sites/epd.georgia.gov/files/related_files/site_page/IC-63.pdf
- Gordon, D.W., Peck, M.F., and Painter, J.A., 2012, Hydrologic and water-quality conditions in the lower Apalachicola–Chattahoochee–Flint and parts of the Aucilla–Suwanee–Ochlockonee River basins in Georgia and adjacent parts of Florida and Alabama during drought conditions, July 2011: U.S. Geological Survey Scientific Investigations Report 2012–5179, 69 p., 1 sheet, available online at http://pubs.usgs.gov/sir/2012/5179/.
- Helsel, D.R., Hirsch, R.M., Ryberg, K.R., Archfield, S.A., and Gilroy, E.J., 2020, Statistical methods in water resources: U.S. Geological Survey Techniques and Methods, book 4, chap. A3, 458 p., https://doi.org/10.3133/tm4a3.
- Hicks, D.W., Krause, R.E., and Clarke, J.S., 1981, Geohydrology of the Albany area, Georgia: Georgia Geologic Survey Information Circular 57, 31 p., https://epd.georgia.gov/sites/epd.georgia.gov/files/related_files/site_page/IC-57.pdf.
- Jones, L.E., and Maslia, M.L., 1994, Selected groundwater data, and results of aquifer tests for the Upper Floridan aquifer, Brunswick, Glynn County, Georgia, area: U.S. Geological Survey Open-File Report 94–520, 107 p., https://pubs.er.usgs.gov/publication/ofr94520
- Krause, R.E., and Randolph, R.B., 1989, Hydrogeology of the Floridan aquifer system in southeast Georgia and adjacent parts of Florida and South Carolina: U.S. Geological Survey Professional Paper 1403–D, 65 p., https://pubs.er.usgs.gov/publication/pp1403D.
- National Integrated Drought Information System, accessed June 20, 2025 at URL https://www.drought.gov/historical-information?state=georgia.
- National Oceanic and Atmospheric Administration, accessed June 20, 2025, at URL https://www.ncei.noaa.gov/news/national-climate-202312.
- National Weather Service, Climate Prediction Center, Drought Monitoring, accessed June 20, 2020 at URL https://www.cpc.ncep.noaa.gov/products/monitoring_and_data/drought.shtml.
- Painter, J.A., 2019, Estimated use of water in Georgia for 2015 and water-use trends, 1985–2015: U.S. Geological Survey Open-File Report 2019–1086, 216 p., https://doi.org/10.3133/ofr20191086.
- Peck, M.F., Joiner, C.N., and Cressler, A.M., 1992, Groundwater conditions in Georgia, 1991: U.S. Geological Survey Open-File Report 92–470, 137 p., https://pubs.er.usgs.gov/publication/ofr92470.
- Peck, M.F., McFadden, K.W., and Leeth, D.C., 2005, Effects of decreased ground-water withdrawal on ground-water levels and chloride concentrations in Camden County, Georgia, and ground-water levels in Nassau County, Florida, from September 2001 to May 2003: U.S. Geological Survey Scientific Investigations Report 2004–5295, 36 p., accessed June 20, 2025, at https://pubs.usgs.gov/sir/2004/5295.
- Pollard, L.D. and Vorhis, R.C., 1980, The geohydrology of the Cretaceous aquifer system in Georgia: Georgia Geologic Survey Hydrologic Atlas 3, 5 sheets, at https://epd.georgia.gov/sites/epd.georgia.gov/files/related_files/site_page/HA-3.pdf.
- Taylor, C.J., and Alley, W.M., 2001, Groundwater-level monitoring and the importance of long-term water-level data: U.S. Geological Circular 1217, 68 p., accessed June 20, 2025, at https://pubs.usgs.gov/circ/circ1217/.
- U.S. Drought Monitor, accessed June 20, 2025 at URL Time Series | U.S. Drought Monitor (unl.edu).
- U.S. Geological Survey, USGS Cooperative Matching, accessed June 20, 2025 at URL https://www.usgs.gov/mission-areas/water-resources/science/usgs-cooperative-matching-funds?qt-science_center_objects=0#qt-science_center_objects.