Bacteria
What are bacteria?
Bacteria are common single-celled organisms and are a natural component of lakes, rivers, and streams. Most of these bacteria are harmless to humans; however, certain bacteria, some of which normally inhabit the intestinal tract of warm-blooded animals, have the potential to cause sickness and disease in humans. High numbers of these bacteria often indicate high numbers of other harmful bacteria as well as other disease-causing microorganisms and viruses.
Fecal indicator bacteria
The human health risk from water-borne pathogens is usually assessed from concentrations of fecal indicator bacteria (FIB) such as Escherichia coli (E. coli), enterococci, and fecal coliform. Fecal indicator bacteria originate from the same sources as the pathogens (disease-causing microorganisms and viruses) of interest but do not always accurately reflect the human risk to illness. The human health risk may be dependent on the source of the fecal contamination, with initial studies indicating that FIBs from human and fresh cattle feces are associated with similar illness rates while FIBs from fresh gull, chicken, and pig feces are associated with lower illness rates than human sources (Schoen and Ashbolt, 2010; Soller and others, 2010). E. coli typically does not replicate outside of the gastrointestinal tracts of warm-blooded animals, whereas other types of fecal coliforms have been shown to replicate more readily in natural environments (McLellan and others, 2001). Fecal indicator bacteria can survive for several days in surface waters and for months in lake sediments where they are protected from viral or bacterial predators and from ultraviolet light that can inactivate bacteria such that they cannot replicate and cause infection (Darakas, 2002). Fecal indicator bacteria are used for regulatory purposes because they can be determined in a cost effective and timely manner, whereas monitoring for pathogens can require separate analyses for each individual pathogen and can be expensive and time consuming.
Human sources of fecal-associated bacteria in surface waters include leaking septic tanks, sewer overflows, conveyance leaks, and from perturbations at sewage treatment plants. Animal sources in surface waters include direct inputs and storm runoff of fecal matter from wildlife, livestock, and dogs (Soller and others, 2010; Riedel and others, 2015). A recent microbial source tracking study within the Chattahoochee River National Recreation Area (CRNRA) watershed indicated that humans and dogs were the primary contributors of bacterial contamination among sources tested (humans, dogs, and ruminants; McKee and others, 2020).
- Darakas, E., 2002, E. coli kinetics—Effect of temperature on the maintenance and respectively the decay phase: Environmental Monitoring and Assessment, v. 78, no. 2, p. 101–110, accessed April 20, 2020, at https://doi.org/10.1023/A:1016313520396.
- McKee, A., Molina, M., Cyterski, M., and Couch, A., 2020, Microbial source tracking (MST) in Chattahoochee River National Recreation Area—Seasonal and precipitation trends in MST marker concentrations, and associations with E. coli levels, pathogenic marker presence, and land use: Water Research, v. 171, 12 p., accessed April 20, 2020, at https://doi.org/10.1016/j.watres.2019.115435.
- McLellan, S.L, Daniels, A.D., and Salmore, A.K., 2001, Clonal populations of thermotolerant Enterobacteriaceae in recreational water and their potential interference with fecal Escherichia coli counts: Applied and Environmental Microbiology, v. 67, no. 10, p. 4934–4938, accessed April 20, 2020, at https://doi.org/10.1128/AEM.67.10.4934-4938.2001.
- Riedel, R.E, Thulsiraj, V., Zimmer-Faust, A.G., Dagit, R., Krug, J., Hanly, K.T., Adamek, K., Ebentier, D.L., Torres, R., Cobian, U., Peterson, S., and Jay, J.A., 2015, Long-term monitoring of molecular markers can distinguish different seasonal patterns of fecal indicating bacteria sources: Water Research, v. 71, p. 227–243, accessed April 20, 2020, at https://doi.org/10.1016/j.watres.2014.12.037.
- Schoen, M.E., and Ashbolt, N.J., 2010, Assessing pathogen risk to swimmers at non-sewage impacted recreational beaches: Environmental Science & Technology, v. 44, p. 2286–2291, accessed April 20, 2020, at https://doi.org/10.1021/es903523q.
- Soller, J.A., Schoen, M.E., Bartrand, T., Ravenscroft, J.E., and Ashbolt, N.J., 2010, Estimated human health risks from exposure to recreational waters impacted by human and non-human sources of faecal contamination: Water research, v. 44, no. 16, p. 4674–4691, accessed April 20, 2020, at https://doi.org/10.1016/j.watres.2010.06.049.
Escherichia coli bacteria
Escherichia coli (E. coli) is a rod-shaped bacterium commonly found in the gastrointestinal tract and feces of warm-blooded animals. It is a member of the fecal coliform group of bacteria and is distinguished by its inability to break down urease. This bacterium is a preferred indicator for freshwater recreation and its presence provides direct evidence of fecal contamination from warm-blooded animals. Although usually harmless, E. coli can cause illnesses such as meningitis, septicemia, urinary tract, and intestinal infections. A recently discovered strain of E. coli (E. coli 0157:H7) can cause severe disease and may be fatal in small children and the elderly.
U.S. EPA Beach Action Value
The U.S. Environmental Protection Agency (EPA; 2012) has developed Beach Action Value (BAV) criteria for fecal indicator bacteria, above which indicate potentially unsafe conditions for primary contact recreation such as swimming and tubing. The BAV criteria for E. coli concentrations in fresh water is 235 colony forming units per 100 mL of water, representing a gastrointestinal illness risk-level of 36 people per 1,000 primary contact recreators. The EPA recommendations were developed for the general population including children and have not been evaluated for persons over 55 years of age, pregnant women, or other vulnerable individuals such as those that are immune compromised.
Other factors that determine if a person will become sick:
- how long someone is in contact with the water
- if water come into contact with a person's mouth or eyes
- if the person has any skin abrasions that will allow water to enter the body
- the age and health of the person as that can determine a person's susceptibility to illness
It is important to note that these indicators represent an increased potential to contract illness. The public should use this information and other available data to guide their decisions in use of the Chattahoochee River within the CRNRA.
- U.S. Environmental Protection Agency [EPA], 2012, Recreational Water Quality Criteria: U.S. Environmental Protection Agency Office of Water report number 820-F-12-058, 63 p., assessed April 20, 2020, at https://www.epa.gov/sites/production/files/2015-10/documents/rwqc2012.pdf.
BacteriALERT predictive modeling
Given the potential human health risk to visitors of the Chattahoochee River National Recreation Area (CRNRA) from water contact with fecal-associated pathogens and the possible repercussions on Park recreational activities from overestimating fecal-associated bacteria levels, it is important to provide as accurate and timely advisories of the potential health risk of fecal bacteria as possible. The U.S. Geological Survey has developed regression models for predicting E. coli concentrations at the three USGS BacteriALERT stations. These data are to be used for health risk advisories for primary recreational use in the CRNRA (Aulenbach and McKee, 2020). E. coli estimates from these models are generally updated hourly on the BacteriALERT website.
Variables in the E. coli models include: at-site streamflow, turbidity, water temperature, upstream tributary streamflow, day of year (season), and decimal year (long-term trend). E. coli concentrations tend to be higher when at-site streamflow, upstream tributary streamflow, and at-site turbidities are higher, and during the summer when water temperatures are higher. E. coli concentrations tend to be higher when streamflow is higher due to the resuspension of E. coli in the water column and associated increases in suspended sediment for which a substantial portion of the bacteria can be attached to (Fries and others, 2006; Krometis and others; 2007). Turbidity, which is a reading of the cloudiness of water, is a water-quality surrogate for suspended sediment and a good indicator of high E. coli concentrations. The relation between E. coli concentrations and upstream tributary flows indicates that the tributary watersheds are a likely source of E. coli bacteria.
An evaluation of the predictive model performance is illustrated in figure 1. The percentage of samples that exceeded the U.S. Environmental Protection Agency Beach Action Value (BAV; USEPA, 2012) is 12.5 percent for Norcross (Medlock Bridge), 37.1 percent for Powers Ferry, and 24.5 percent for Atlanta (Paces Ferry), which is the sum of the “both exceed” and “false negative” categories. The misidentification rate of the predictive models is low, ranging from 3.5 percent of the time for Norcross to 11.3 percent of the time at Powers Ferry. The frequency of false negatives, in which model predictions indicate safe conditions while observed concentrations indicate that the BAV criteria was actually exceeded, ranged from 2.3 percent at Norcross to 5.8 percent at Atlanta.
- Aulenbach, B.T., and McKee, A.M., 2020, Monitoring and real-time modeling of E. coli bacteria for the Chattahoochee River, Chattahoochee River National Recreation Area, Georgia, 2000–2019: U.S. Geological Survey Open-File Report 2020–1048, 43 p., https://doi.org/10.3133/ofr20201048.
- Fries, J.S., Characklis, G.W., and Noble, R.T., 2006, Attachment of fecal indicator bacteria to particles in the Neuse River Estuary, North Carolina: Journal of Environmental Engineering, v. 132, no. 10, p. 1338–1345, accessed April 20, 2020, at https://doi.org/10.1061/(ASCE)0733-9372(2006)132:10(1338).
- Krometis, L.H., Characklis, G.W., Dilts, M.J., Simmons, O.D., III, Likirduplos, C.A., and Sobsey, M.D., 2007, Intra-storm variability in microbial partitioning and microbial loading rates: Water Research, v. 41, no. 2, p. 506–516, accessed April 20, 2020, at https://doi.org/10.1016/j.watres.2006.09.029.
- U.S. Environmental Protection Agency [EPA], 2012, Recreational Water Quality Criteria: U.S. Environmental Protection Agency Office of Water report number 820-F-12-058, 63 p., assessed April 20, 2020, at https://www.epa.gov/sites/production/files/2015-10/documents/rwqc2012.pdf.
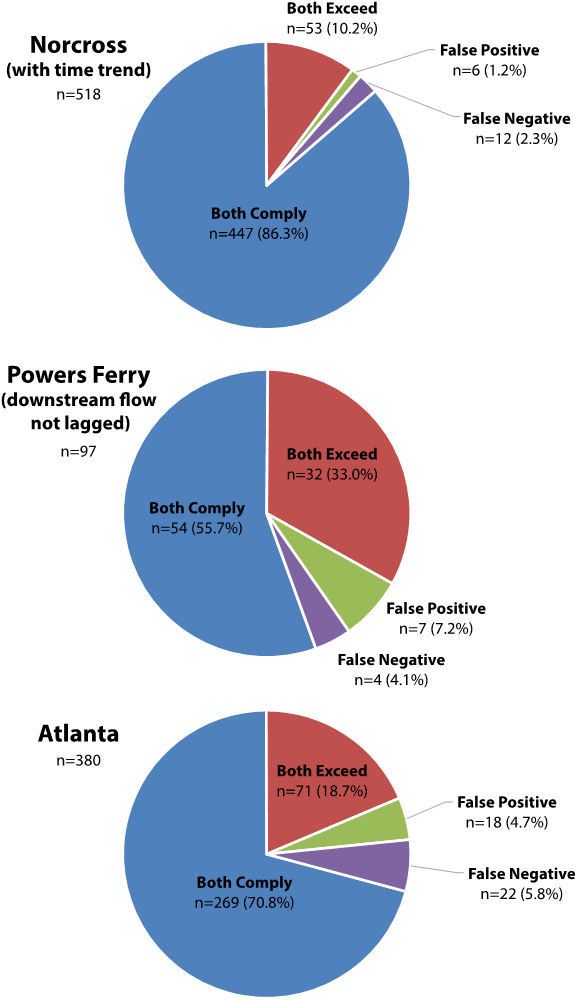
Figure 1. Pie charts showing the frequency observed and model predicted Escherichia coli (E. coli) densities complied with or exceeded the Beach Action Value (BAV) of 235 colony forming units per 100 mL at the three BacteriALERT stations for the model calibration period (October 4, 2007, to May 23, 2019; June 16, 2016, to May 23, 2019, for Powers Ferry). Does not include outliers. False positives indicate the predicted densities exceeded the BAV while the observed densities did not exceed the BAV; false negatives indicate the observed densities exceeded the BAV while the predicted densities did not exceed the BAV. Abbreviations: mL, milliliters; n, number of samples; %, percent.